Header-Nozzle Intersection
Sample Applications
Header-Nozzle Intersection
Pressurised thermal shock analysis in a cracked header/nozzle intersection
This example shows analysis of a defect through a typical pressurized thermal shock transient for a small-break loss-of-coolant accident in a header-nozzle intersection. The header pipe has a 30 inch outer diameter and 31/8 inch wall thickness. The nozzle has a 105/8 inch outer diameter and 15/16 inch wall thickness. The aim of the analysis is to determine the time history of stress intensity factor at the ends of the crack front and on a 45 degree line through the component cross-section.
The uncracked component, the crack position and the mesh with the crack in place are shown in Figures 1 and 2. The time history of internal pressure and temperature are shown in Figure 3 and are a combination of data given in two references:
- Variable Flaw Shape Analysis for a Reactor Vessel Under Pressurized Thermal Shock Loading
Yang & Bamford, Fracture Mechanics Vol. 17, ASTM STP 905, 1986, pp41-58 -
Influence of Pressurised Thermal Shock on Nuclear Pressure Vessel
Lisha, Hongguang, Huiji, (Tsinghua University), Research Reports of Structural Engineering and Vibration 7, Tsinghua University Press Ltd, 2006
Typical temperature dependent steel data has been used in the finite element analysis. The data for Young’s modulus and Poisson ratio is also part of the Zencrack input data.
The transient analysis is carried out as a sequential thermal-stress analysis:
- Heat transfer run to develop temperature distribution as a function of time
- Stress analysis using the heat transfer results as one of the inputs, plus pressure loading
Abaqus allows interpolation of temperatures from one mesh to a dis-similar mesh so an uncracked model heat transfer analysis can provide the temperature input for the Zencrack analysis of the cracked mesh.
Results are extracted from the analysis at the two end points of the crack and at the intersection of a 45 degree line with the crack front, as shown in Figures 4 and 5. The results at this intersection point are generated by Zencrack's post-processing program, PROCESS, by interpolating data from the adjacent crack front nodes.
The temperature time history for the three output points is shown in Figure 4. The curves are virtually the same for all three points although, as would be expected, the point on the 45 degree line does have a small time lag compared to the surface points. The 45 degree line does, however, show a significantly higher K value than the two end points, reaching almost 1400MPasqrt(mm) at a time of around 1000 seconds (Figure 5).
Figure 1 - Uncracked quarter symmetry model and crack position
Figure 2 - Uncracked and cracked meshes at the crack position
Figure 3 - Pressure and temperature time histories
Figure 4 - Temperature time histories
Figure 5 - K time histories


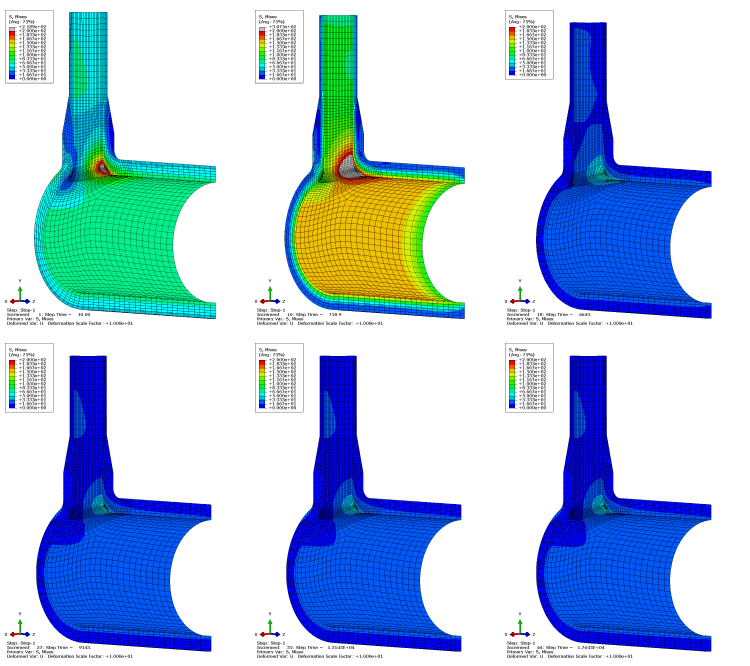
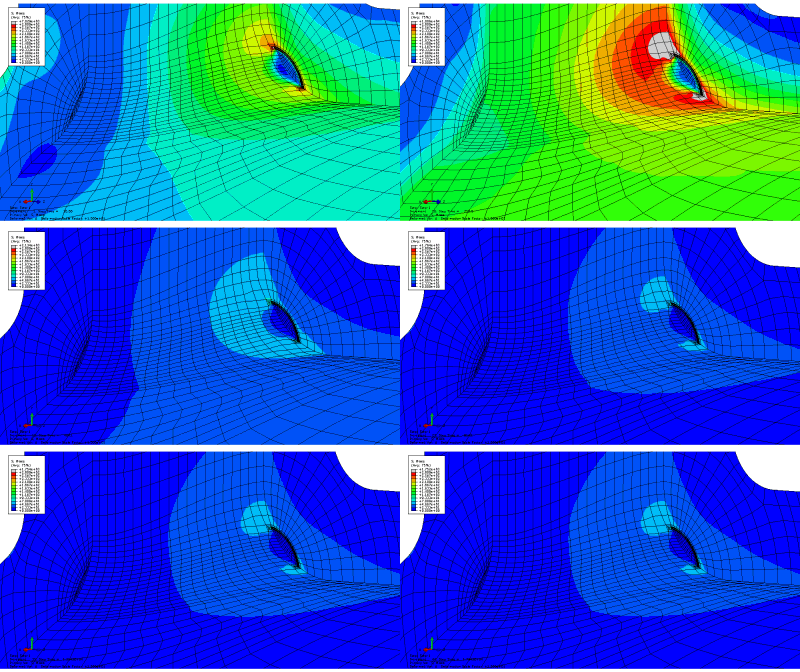
Figure 6 - Von Mises stress contours (uncracked mesh and crack region of cracked mesh)


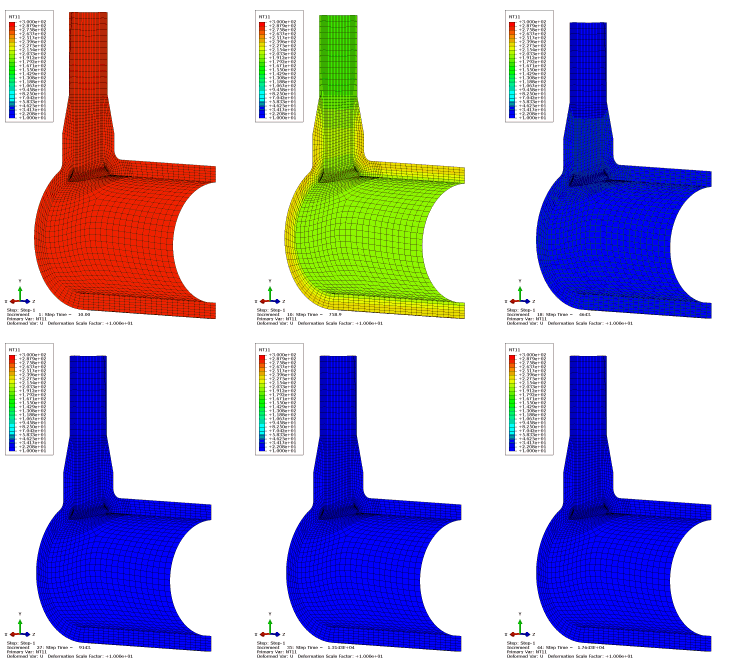
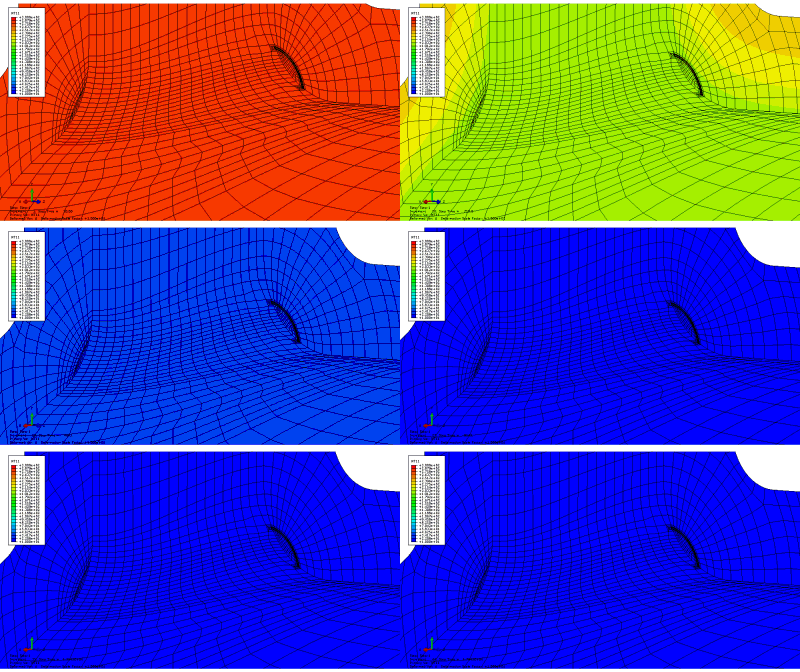
Figure 7 - Temperature contours (uncracked mesh and crack region of cracked mesh)