Residual Stress
Sample Applications
Residual Stress
The effect on crack growth of residual stress induced by shot peening
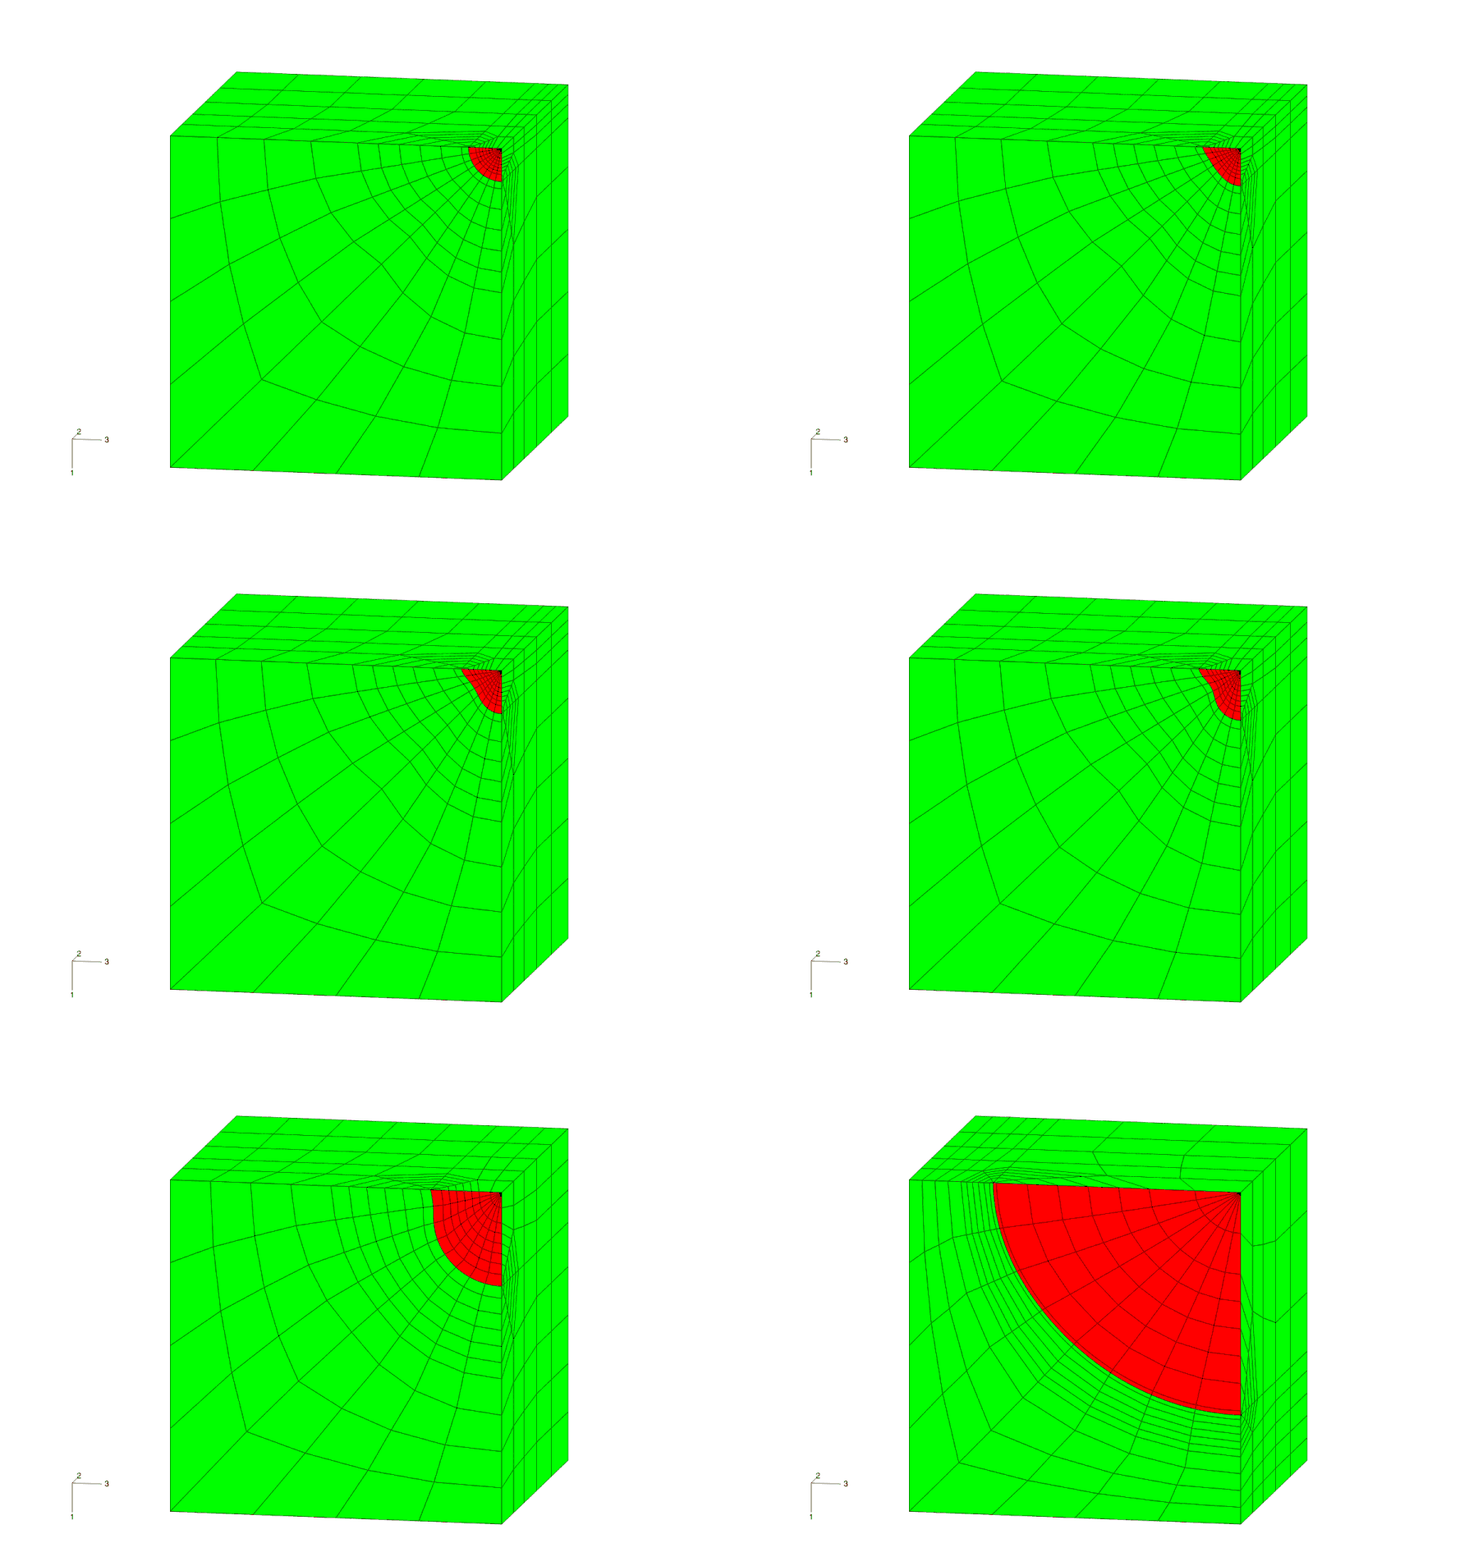
This example shows the growth of an initially semi-circular crack in a specimen that has been shot peened on the free surface to introduce a compressive residual stress near the surface. The model is a quarter symmetry model with external loading applied as a uniform pressure load on the remote surface opposite the symmetry plane containing the crack front. The "top" surface as shown in Figure 1 is the free shot peened surface. The "right" and "front" surfaces in Figure 1 are the symmetry planes, with the crack lying in the front symmetry plane. The initial crack region, with crack radius 0.1mm, is shown Figure 2 in which the crack face is highlighted in red. Although not shown here, the crack growth data was in tabular form (i.e. as a function of R), and included threshold cut-offs.
The residual stress distribution applied as a result of the surface treatment is a 1D distribution i.e. a function of stress vs distance from the treated surface. A typical distribution is shown in Figure 3. The peak compressive region is close to the surface, in this case at a depth of about 0.1mm. The effect of this compressive residual stress is to reduce the crack growth in a region close to the surface. The aim of the analysis is to demonstrate the effect that this has on crack shape development and remaining life.
Results from four analyses are shown in Figures 4 to 7. These are for:
- External load at R=0.75 without residual stress
- External load at R=0.75 with residual stress
- External load at R=0 without residual stress
- External load at R=0 with residual stress
In both analyses without residual stress the crack grows in an elliptic type shape. This is the behaviour that would be expected. When the residual stress is included, the growth is retarded along the treated surface. This effect is far more pronounced at R=0 than at R=0.75, as can be seen by comparing the profiles in Figures 4 and 5.
The effect of the residual stress on the life is shown in Figures 6 and 7. For R=0.75 the life increases by a factor of almost 2 compared with the analysis without residual stress. For R=0 the increase is a factor of around 30. This clearly demonstrates the importance of residual stress effects in life calculations.
The type of crack shape development shown here is typical of that found after shot peening and other similar surface treatments (e.g. see the reference listed below).
Figure 1 - Quarter symmetry model with initial crack
Figure 2 - The crack region for the initial crack
Figure 3 - Typical residual stress distribution from shot peening for titanium alloy
Figure 4 - Effect of residual stress on crack shape development for R=0.75
Figure 5 - Effect of residual stress on crack shape development for R=0
Figure 6 - Effect of residual stress on life for R=0.75
Figure 7 - Effect of residual stress on life for R=0

Figure 8 - The crack growth for the R=0.75 analysis with residual stress
References
FOD Resistance And Fatigue Crack Arrest In Low Plasticity Burnished IN718, P.S.Prevéy, J.Telesman, T.Gabb, P.Kantzos, 5th National Turbine Engine High Cycle Fatigue Conference, Chandler, Arizona, U.S.A, Mar 7-9 2000.