- Software
- Zencrack
- Technical
- Pre and Post Processing
Output Files
Pre and Post Processing
Output Files
The main user-readable Zencrack output file is in a text file with a variety of different tabular reports. All output reports can be turned on or off by the user. Available reports depend upon the analysis type but may include:
- Echo, processing and summary reports of user input
- Spectrum input file details and statistics
- "Raw" displacement results from f.e. analysis
- Local opening displacements and open / closed status at crack front
- Stress intensity factors calculated from nodal displacements
- "Raw" j-integral results from f.e. analysis
- Local energy release rates calculated from j-integral results
- Maximum energy release rates - magnitudes and growth directions - calculated from the local values
- Growth prediction (detail or summary)
Although these output tables can contain a large amount of data, it is important to note that the tables are present. In other words, manual effort is reduced considerably as a result of the automatic processing of the f.e. results by Zencrack. This is the case for analyses with or without crack growth.
In addition to crack-specific processing noted below in the Zencrack GUI, there will also be a requirement to post-process the finite element output files.
Crack Profiles and XY Plots
Crack growth profiles and crack surfaces can be visualised in the Zencrack GUI by import of the .vis analysis output file. XY plots can also be created from the analysis results. This is the fastest way to visualise the crack growth and to generate results plots. An alternative method is available which requires execution of additional post-processing utilities.
This video shows some post-processing features in version 8.2-1 of the GUI.
Detailed Integration Output
Information about the details of the integration process at one or more crack front nodes can be requested in the Zencrack input file. If such a request is made, the additional data is generated in separate output files, one per requested crack front node. This data can be used for plotting in the Zencrack GUI or imported directly into a spreadsheet. If the detailed integration output is not requested, a coarser set of data at positions at which the f.e. analyses occur can be extracted from the main output file to produce xy plots.
In the example shown here, the detailed integration output (red line) can be seen to vary through the spectrum load history whereas the coarser f.e. "snapshot" data (blue line) produces a less detailed "global" response.

Detailed integration output (red line) varies through spectrum load history compared with the "snapshot" f.e. data (blue line)
Finite Element Output Files
Post-processing the finite element results from the steps of an analysis is possible by using standard post-processing software for the finite element program that is being used. This requires that the appropriate files are saved during the analysis.
In a crack growth analysis the user has the option of specifying the frequency at which these potentially large finite element files are saved, e.g. every 5th finite element analysis, retain last file only etc. The file types that can be saved in this way include .odb and .fil for Abaqus, .db and .rst for Ansys and .op2 for Simcenter Nastran. Each file is saved with the f.e. step number appended to the filename e.g. turbinemodel005.odb for mesh 5 of the analysis etc.
For greater control of the saved output or to capture output under certain conditions, a user subroutine option can be used. This permits, for example, saving of the f.e. files when the cycle count is within a certain range or the crack size meets particular criteria.
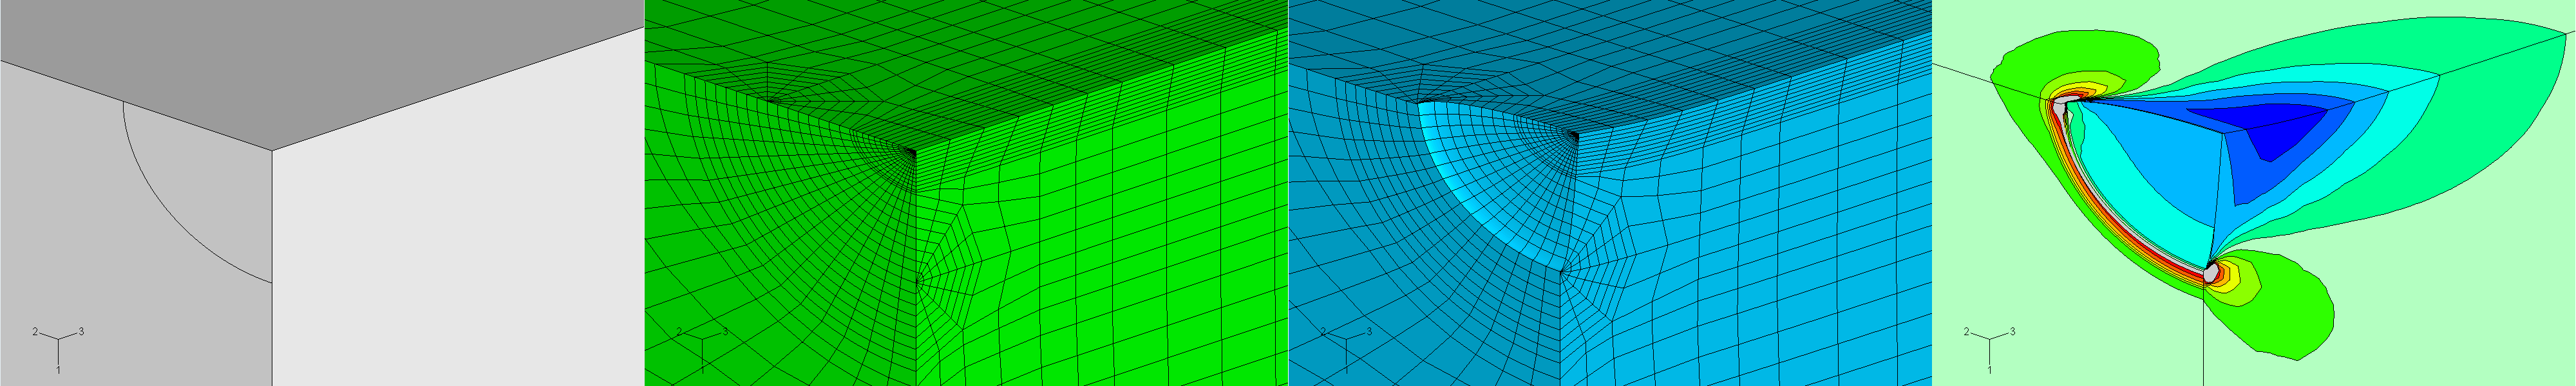
In this way the mesh can be assessed at each saved step. The usual array of post-processing plots can be generated and views can be saved for creating animations of crack growth.
Technical
Pre and Post Processing
More in this category