
- Software
- Zencrack
- What’s New in Zencrack?
Zencrack 8.2-1
What's New in Zencrack?
Zencrack 8.2-1
Zencrack version 8.2-1 was finalised on 21 August 2017
This release includes:
- Improvements in XY plotting in the GUI, including "along crack front" plots.
- New standard form fatigue crack growth laws: Forman and Hartman-Schijve equations.
Zencrack GUI
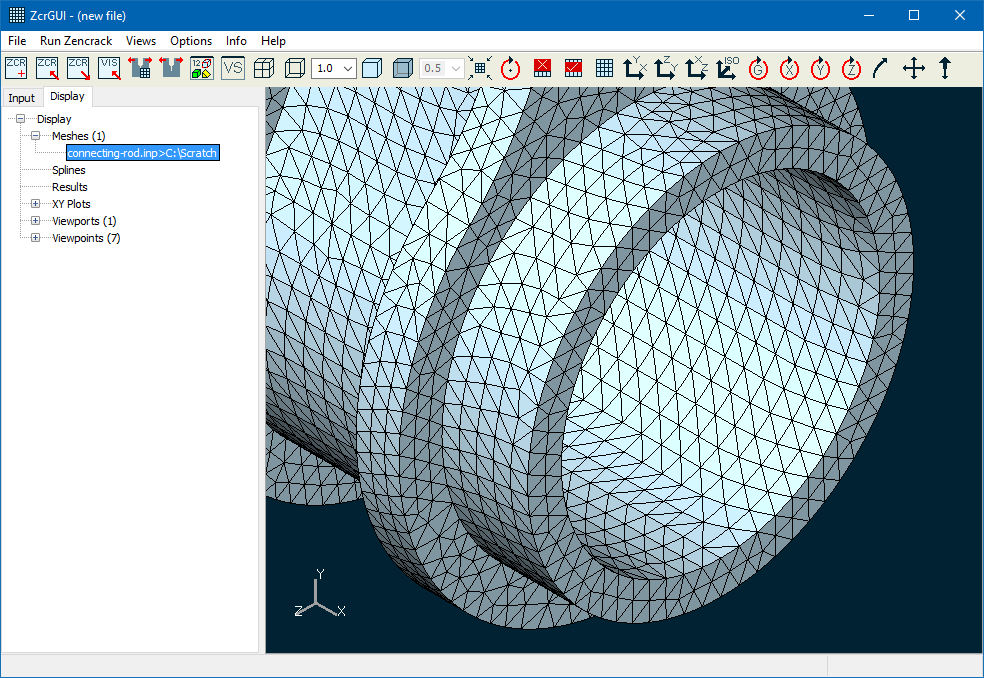
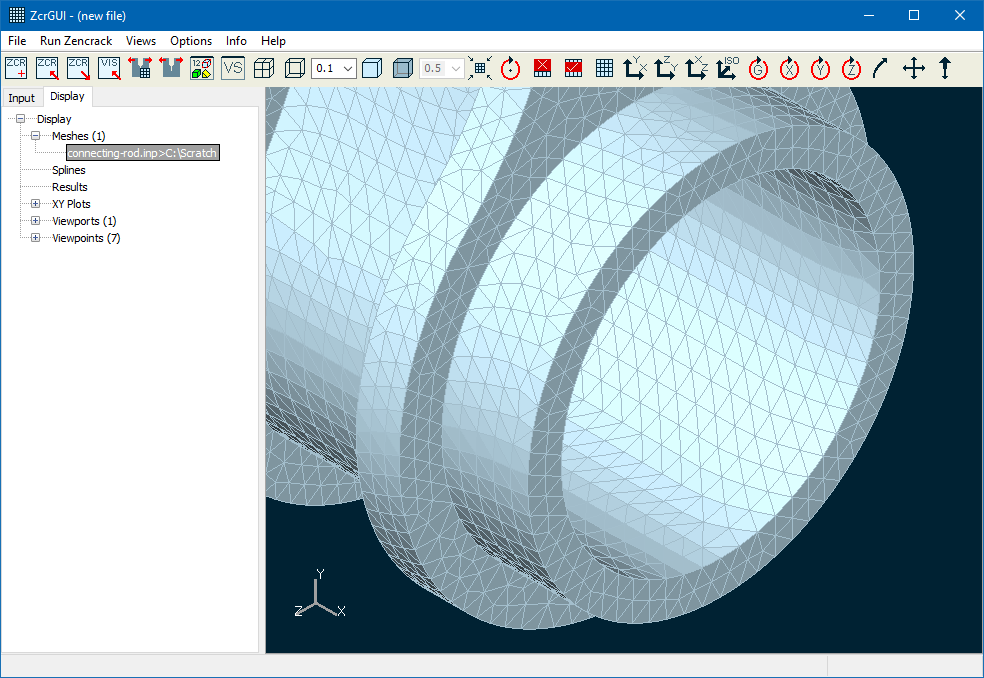
Rendering improvement
A new option is added to control the intensity of the display of mesh element edges. When the option is activated a drop-down box appears in the toolbar between the Wireframe and Filled icons to allow the edge intensity to be set. The action operates on the current mesh viewport and any linked viewports.
XY plotting
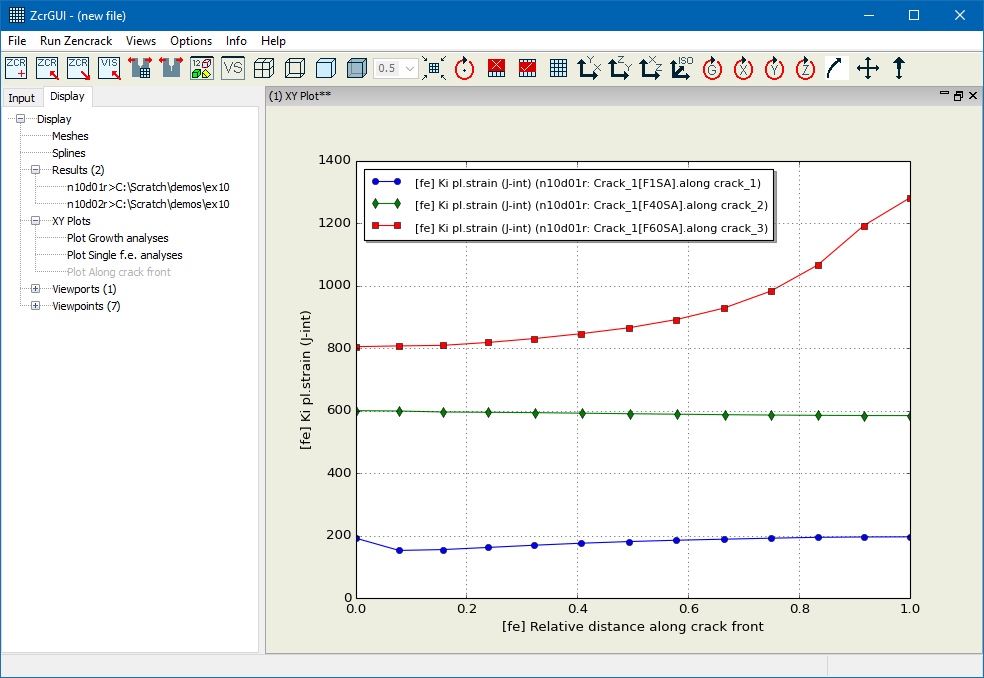
A new "along crack front" XY plot type is available:
- In version 8.1 there were two XY plot types available ("growth" and "single f.e." plots) in the XY Plots section of the Display tab. Each results file could only have one plot type associated with it. In version 8.2-1 the "along crack front" plot type is added and all three plots types can be created and associated with each opened results file (if the results data is appropriate). The x-axis for the new "along crack front" plot type defaults to absolute distance but may be changed to the newly available variable relative distance (which has values 0 to 1) or any of the other available variables.
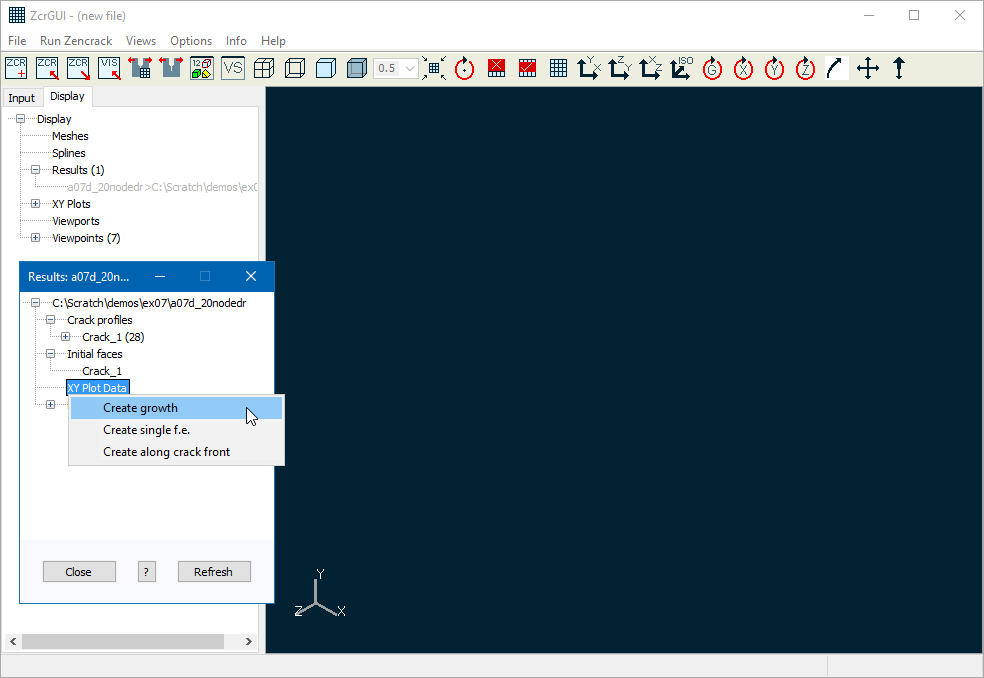
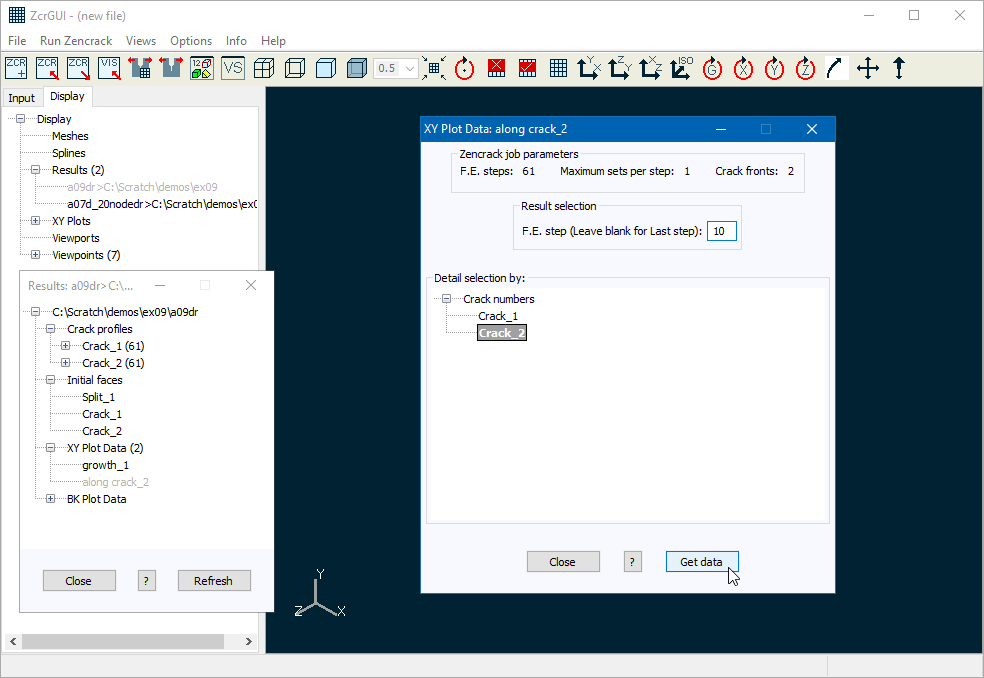
The creation of XY plot data is moved from a double-click on the XY Plot Data branch of the Results screen to a right-click on the XY Plot Data branch. This presents a pop-up to create a type of XY data. The plot types shown on the pop-up depend upon the available data in the results file. On selecting a plot type, a new leaf appears in the XY Plot Data branch of the Results screen tree. Any number of plot types may be added by making multiple right-click selections. Double-clicking one of the entries opens the appropriate screen to allow definition and extraction of data for the plot.
New options on Results screen
The Results screen tree has several new options:
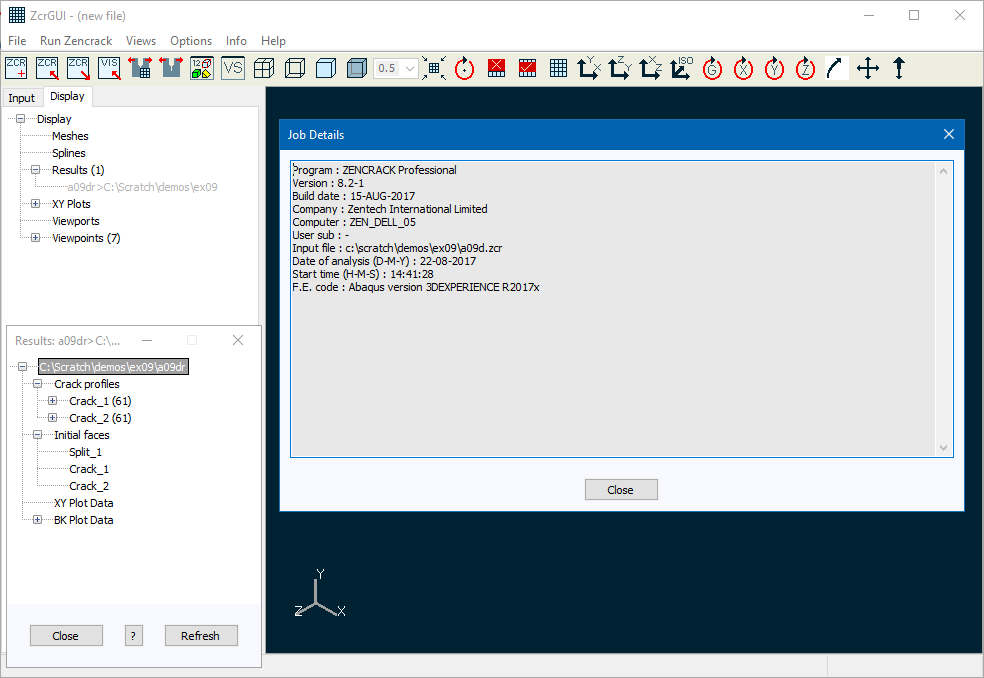
- Double-clicking the first entry in the tree (the results file name and location) opens a window which gives some information about the analysis.
- The right-click for a crack front entry has new options "Export selection" and "Import selection".
- When a growth analysis has a large number of steps it is sometimes useful to de-activate some of the profiles from the display (by expanding the crack front list and double-clicking on profile entries). The currently active list of profiles is saved to a file via the "Export selection" option. A previously exported list of profiles can be set as the active profile list via the "Import selection" option. The exported list is saved to a file in the same folder as the results file with a specific name to identify the results file and the crack front e.g. jobr_Crack_2.txt for crack number 2 in results file jobr.vis.
- The right-click for the BK Plot Data entry has new options "Set all on" and "Set all off".
- When more than one crack front node has detailed integration data available the BK Plot Data entry can be expanded to list the available data. Entries can be de-activated by double-clicking them. This removes them from the list of available data in the XY plot screens. The new "Set all on" and "Set all off" options are shortcuts to allow all the entries to be activated or de-activated without having to double-click each one individually (i.e. the same functionality that was already available for the list of crack profiles).
Changes on the Display tab
The list of Results entries in the Display tab has two new options:
- "Refresh all" on a right-click of Results.
- This option refreshes data for all of the currently opened results files. A confirmation is requested before this action is carried out.
- "Move up" / "Move down" on a right-click of a results file entry.
- When multiple results files are open the order of the items on the Results branch determines the order of legends on xy plots and the sequence in which crack profiles are drawn. These options allow re-ordering of already opened results files to affect the order for these xy plot and display items.
There are several changes in the plotting screens (XY Plots entries on the Display tab):
- If a plotting screen has previously been used, the settings when the screen was dismissed are retained when the screen is re-opened.
- When a single y-axis variable is selected the variable name is automatically entered into the Y label box where it can be modified if required. If multiple y-axis variables are selected the Y label box is reset to blank.
- A new button "Clear Y axis" is added to uncheck all entries in the list of Y-axis variables.
- A new button "Clear Plt" is added to uncheck all entries in the Plt column of the table.
- The "Advanced settings" screen now has a reset button to restore defaults for the line and marker styles.
The Viewpoints entry in the Display tab has two new options on the right-click pop-up:
- The "Set viewpoint" option opens the Set viewpoint screen (Views > Set viewpoint).
- When one or more user viewpoints have been defined the "Delete all user viewpoints" option is available to delete all viewpoints in one action rather than having to delete each one individually.
Miscellaneous improvements
There are a number of other miscellaneous improvements:
- A new colour option is added to control the mesh edge colour in wireframe mode.
- The "custom colours" palette on the colour selection screens is now initialised with a set of standard colours rather than being a blank palette.
- A title is added below the caption on several screens to help identify which data set they relate to: Display tab - Spline, Input tab - Crack Front Viewer, Relax Data, Surface Data.
- A line size option is added to the crack front viewer and display spline screens.
- The import of .vis files is faster.
- The Spectrum input screen is modified to provide some additional information on the behaviour of two tables on the screen and for compatibility with the change in the dataline requirements for the keyword. These changes allow values for the Start and Completed options to be entered without the need to place any entries in the right hand table.
- The layout of several Load system screens is changed to clarify the required and optional items.
- The Load system > Characteristic K input screen is modified to clarify the input requirements for "Number of cycles" and "Duration of 1 cycle".
- Consistency of movement of the model in the viewport under the "rotate" options is improved.
Zencrack changes
New growth laws
Two new "standard" fatigue crack growth law options are added:
- Forman equation
- Hartman-Schijve equation
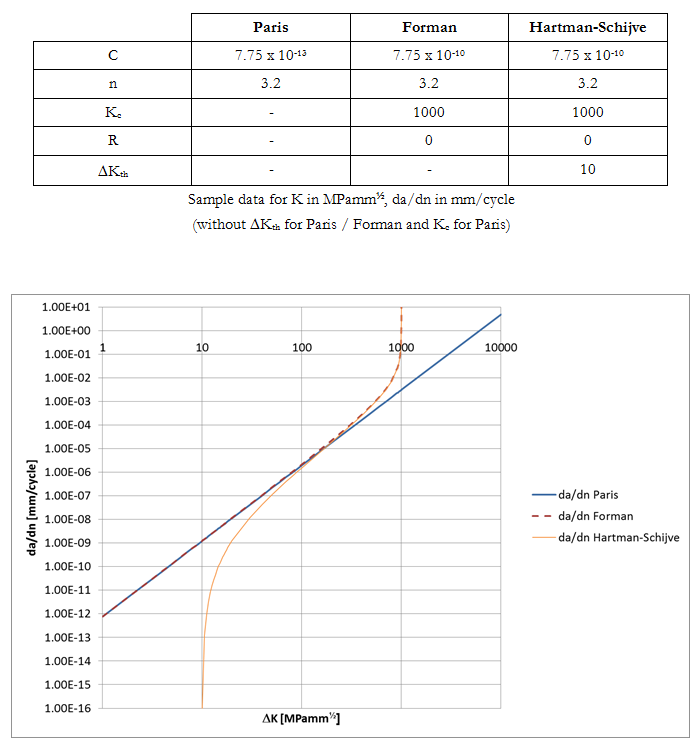
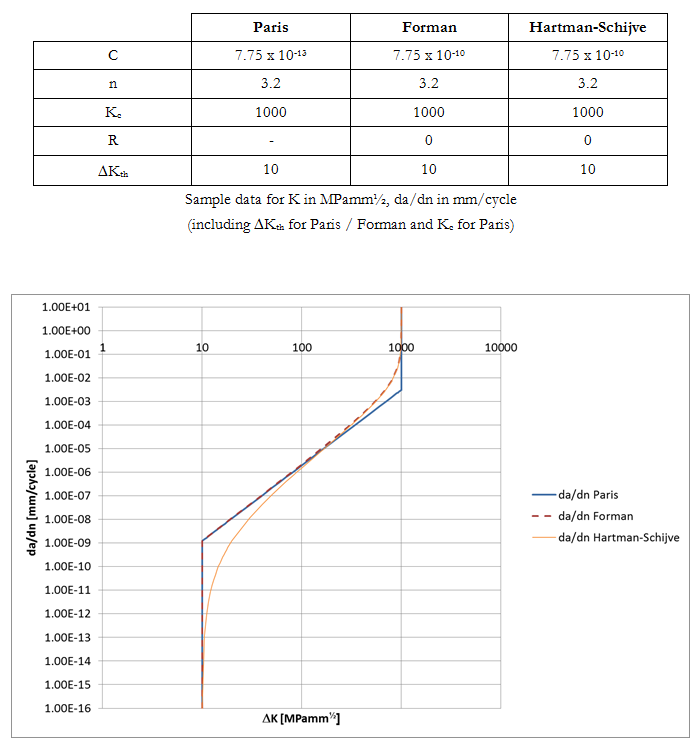
In comparison to the Paris equation, the Forman equation adds a gradual failure limit. The Hartman-Schijve equation adds a gradual threshold limit to the Forman equation. Sample "raw" curves are shown below on the left. If threshold and failure values are included when Paris and Forman equations are used, they produce a step change in the curves as shown below on the right.
Changes in report tables and output
Improvements are made to output formats for very high cycle, time and spectrum counts (>1E9 cycles) with extra precision provided in output fields that report the step and total counts.
The output table in the .rep file which reports absolute distances from end 1 and end 2 of the crack front is changed to report absolute and relative distances from end 1 of the crack front.
Changes in report tables and output
CONSTRAINT VALUES AT CRACK FRONT CORNER NODES
*********************************************
CRACK         N          NODE NO.     DIST AND REL DIST FROM END 1  CONSTRAINT, ALPHA
   1          1          28597        0.00000E+00       0.000000    0.00000E+00
   1          2          28700        7.50000E-01       0.250000    0.00000E+00
   1          3          28879        1.50000E+00       0.500000    0.00000E+00
   1          4          29058        2.25000E+00       0.750000    0.00000E+00
   1          5          29237        3.00000E+00       1.000000    0.00000E+00
The output table in the .rep file which reports the final processed contour integral Gmax values now includes an extra column for the out of plane growth angle.
PROCESSED CONTOUR INTEGRAL DATA FOR CRACK FRONT   1
***************************************************
Gmax DISTRIBUTION FOR CRACK FRONT   1
   N   Gmax  VALUES    DIRECTION (X,Y,Z)                              ANGLE
   1    6.69152E-02    9.92475E-01   -1.22444E-01    0.00000E+00   -4.66810E-01
   2    7.60190E-02    9.92802E-01   -1.19765E-01    3.35899E-06   -6.21458E-01
   3    7.69201E-02    9.92858E-01   -1.19300E-01    0.00000E+00   -6.48315E-01
   4    7.60189E-02    9.92802E-01   -1.19765E-01   -3.35899E-06   -6.21485E-01
   5    6.69153E-02    9.92475E-01   -1.22445E-01    0.00000E+00   -4.66775E-01
The output table in the .rep file which summarises the values associated with a results set now reports a signed angle value rather than an absolute value.
SUMMARY: VALUES ASSOCIATED WITH RESULTS SET    1 FOR F.E. ANALYSIS   1
**********************************************************************
NOTES:  1. TOLERANCE FOR RESETTING THE GROWTH VECTOR TO BE PURE MODE I IS 1.00000E-03 DEGREES.
           THIS CAN BE CHANGED USING *CONTROLS,TOLPLANAR=value.

CRACK       N     Gmax          DIRECTION X,Y,Z                             ANGLE       TEMPERATURE
   1        1     6.69152E-02   9.92475E-01  -1.22444E-01   0.00000E+00  -4.66810E-01   0.00000E+00
   1        2     7.60190E-02   9.92802E-01  -1.19765E-01   3.35899E-06  -6.21458E-01   0.00000E+00
   1        3     7.69201E-02   9.92858E-01  -1.19300E-01   0.00000E+00  -6.48315E-01   0.00000E+00
   1        4     7.60189E-02   9.92802E-01  -1.19765E-01  -3.35899E-06  -6.21485E-01   0.00000E+00
   1        5     6.69153E-02   9.92475E-01  -1.22445E-01   0.00000E+00  -4.66775E-01   0.00000E+00
The Process utility is now always run after completion of each f.e. analysis. This means that a basic .csv file containing analysis results for all nodes is always available upon completion of the analysis.
Miscellaneous changes
The Process utility is now always run after completion of each f.e. analysis. This means that a basic .csv file containing analysis results for all nodes is always available upon completion of the analysis.
Some aspects of the processing of element split sets are speeded up with the improvement being related to the overall model size.
Some aspects of the mesh relaxation process are speeded up, in particular as the number of relaxed nodes on the exterior surface of the model increases if 2nd order elements are used.
The -u and -e command line flags (to specify a user subroutine or existing executable) were previously mutually exclusive. The -u flag would allow a user subroutine to be defined and the resulting executable would always have a version dependent name e.g. zcr82_user.exe. The -e flag can now be used with -u to specify the name of the newly created executable. For example:
runzcr82 -j test -u user_dadn.f -e zcr82_user_dadn.exe
If -u is used without -e the behaviour is the same as before and the executable has a version dependent name, zcr82_user.exe.
There are stability improvements in some aspects of the crack-block mapping process. Also in the creation of the initial crack front when *CRACK FRONT, INITIAL=Points is used. If the mapping fails for some reason, some areas of the code now allow the process to continue to generate a failed mesh to help understand any underlying issues contributing to the failure.
User subroutines
The variables iCRACKfront, NUMBERcfnodes and NODEposition are added to the argument list for user_direction_from_sif and user_g_from_sif to allow identification of the point being processed.
Utility program PROCESS
A new option is added to extract data for all nodes on a specific crack front. This is done by entering cn when requested to enter node numbers to be processed, where n is the crack front number of interest e.g. c2 to extract data for all nodes on crack front 2. If the model contains multiple crack fronts, the cn specification can be repeated e.g. c2 c3 to extract data for all nodes on crack fronts 2 and 3, but no data for crack front 1.