
- Software
- Zencrack
- Zencrack GUI
Post-processing
Zencrack GUI
Post-processing
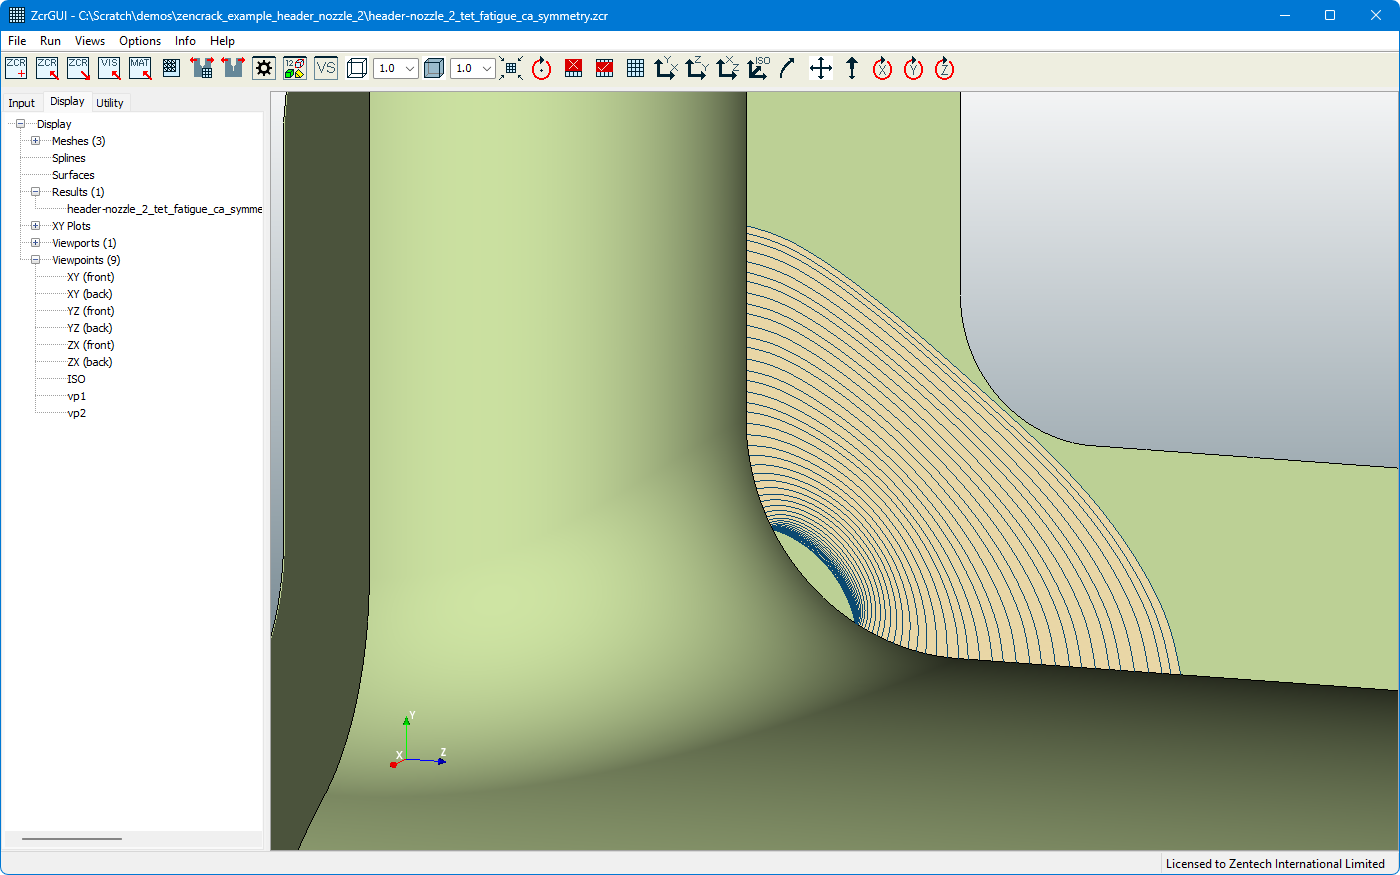
The GUI can be used in several ways for post-processing. Options for post-processing are found on the Display tab in the left pane.
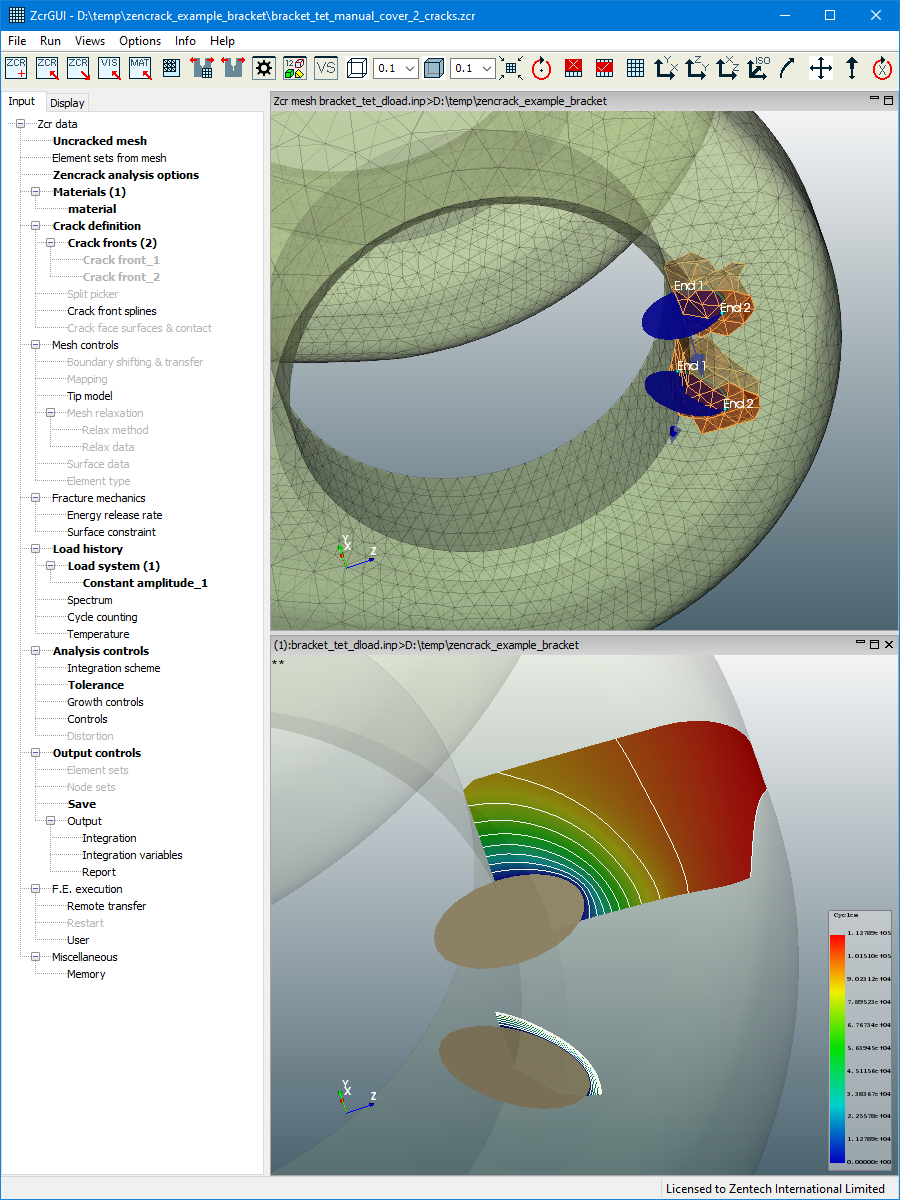
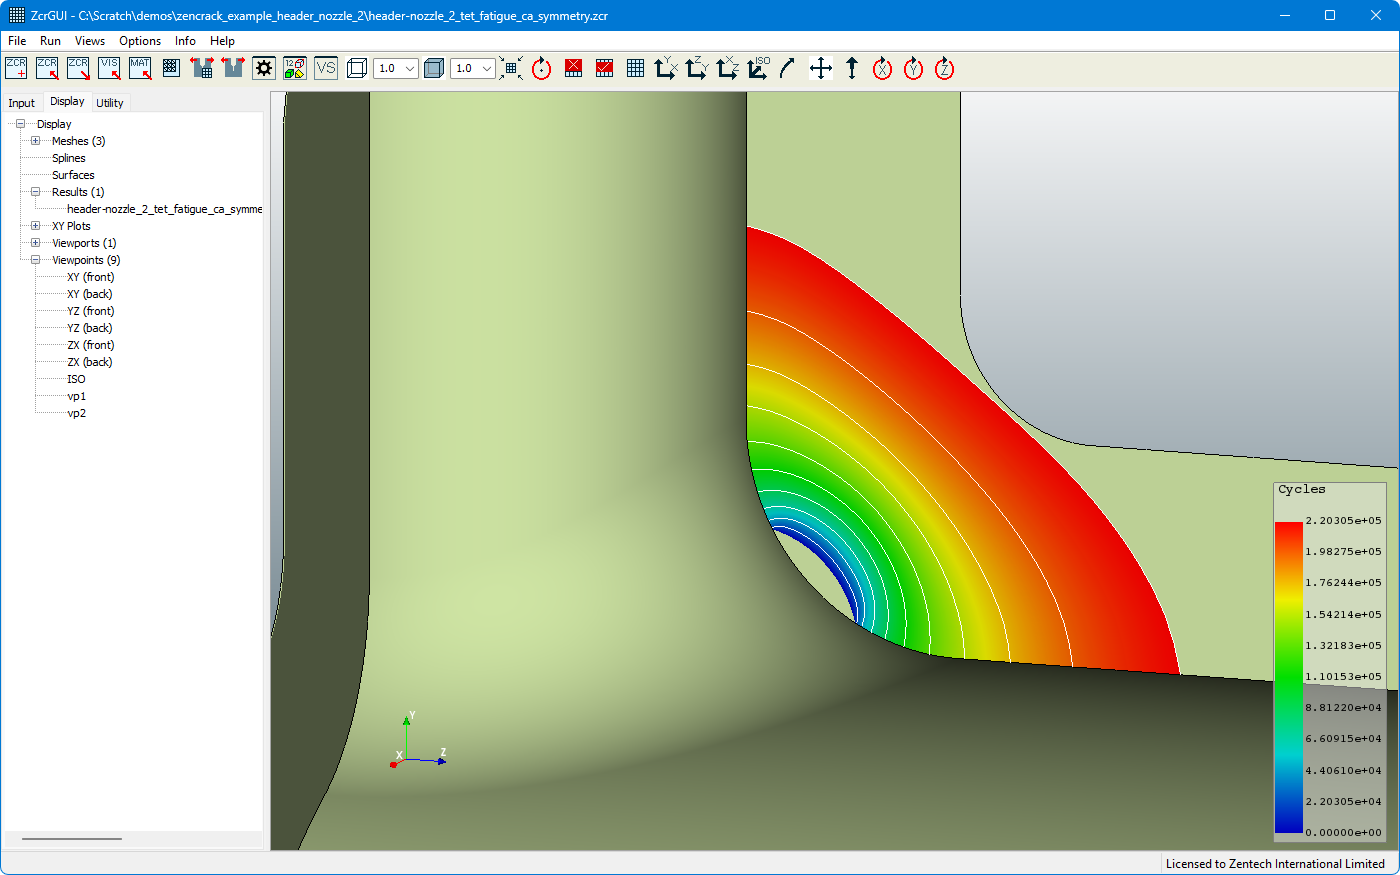
- The crack growth profiles and surfaces can be visualised by direct import of the analysis .vis output file using the "Results" branch in the Display tab tree. The profiles and surfaces may be viewed alone or superimposed on any mesh (cracked or uncracked) that has been imported.
- If profiles are displayed for a job that is still running, a simple "refresh" option automatically updates the display.
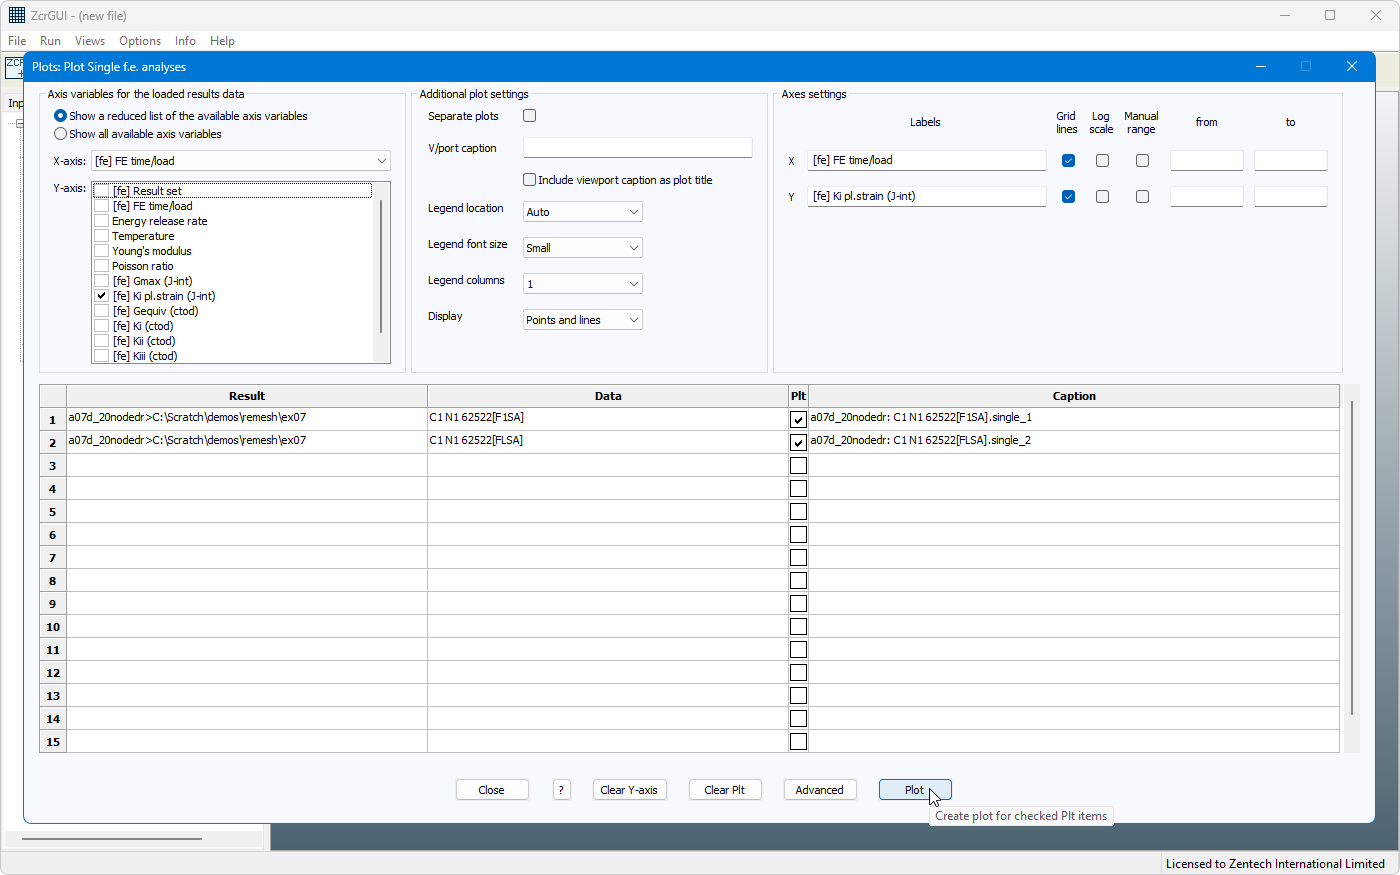
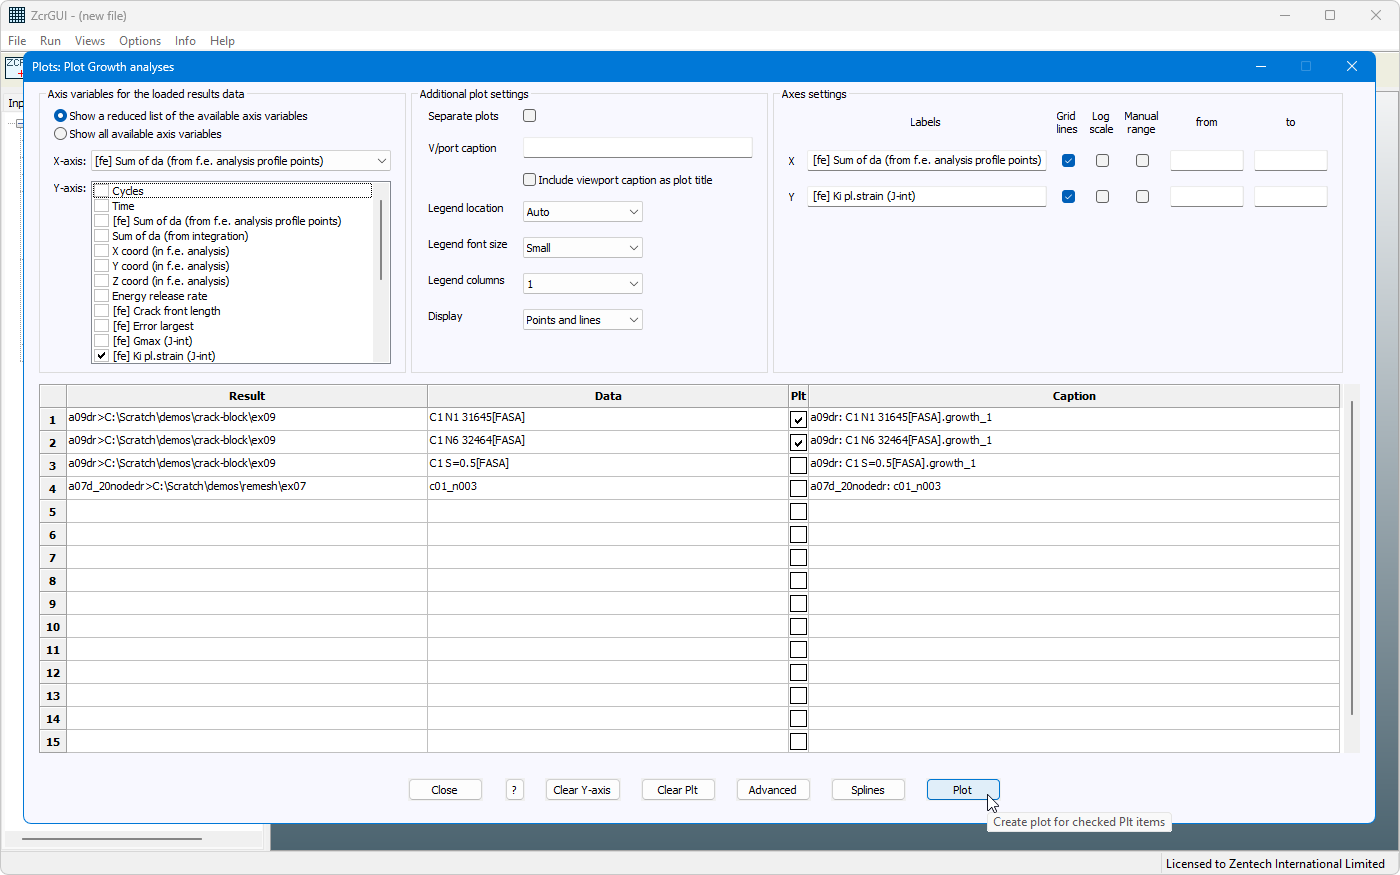
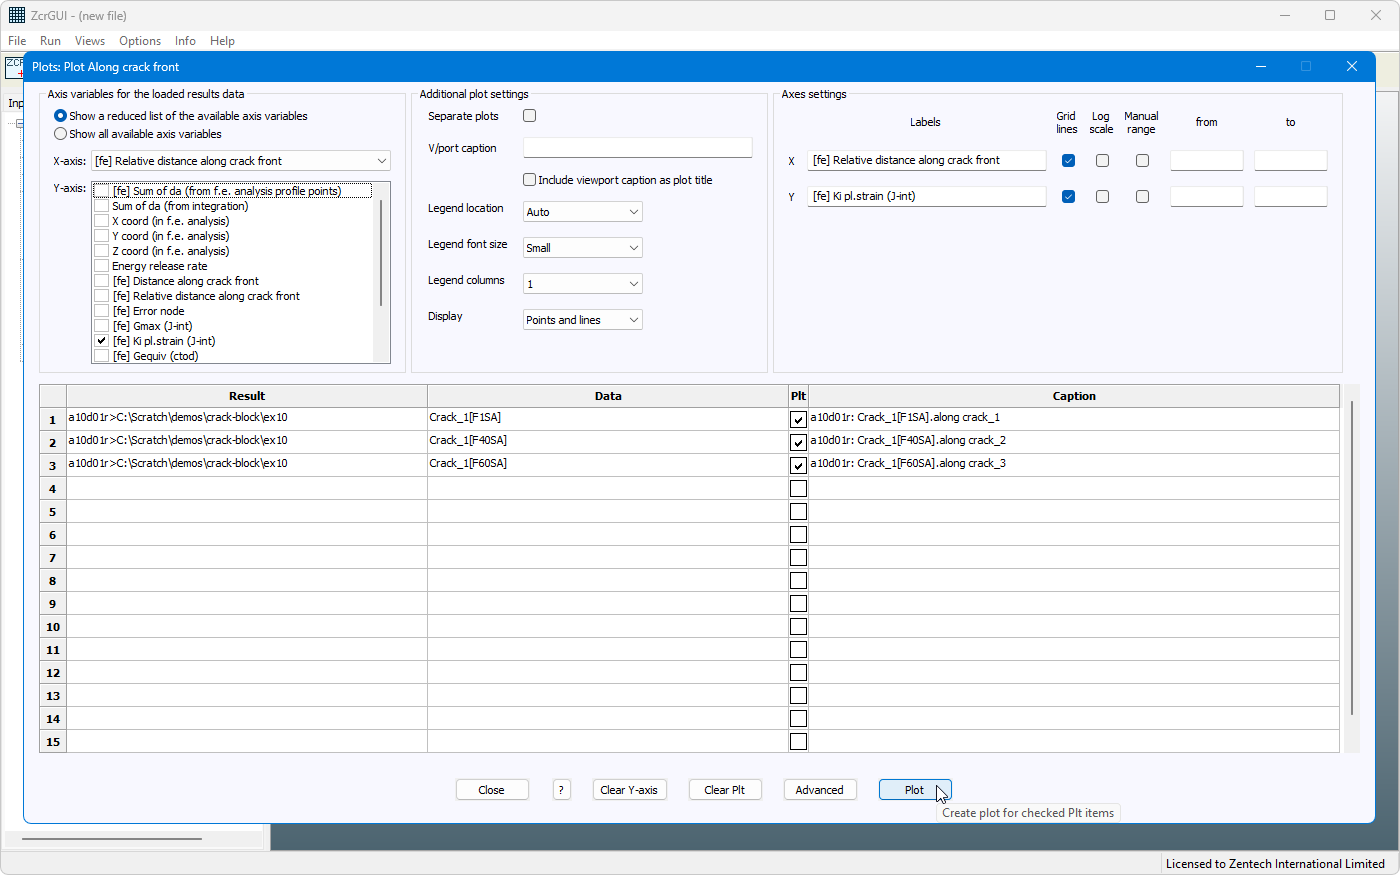
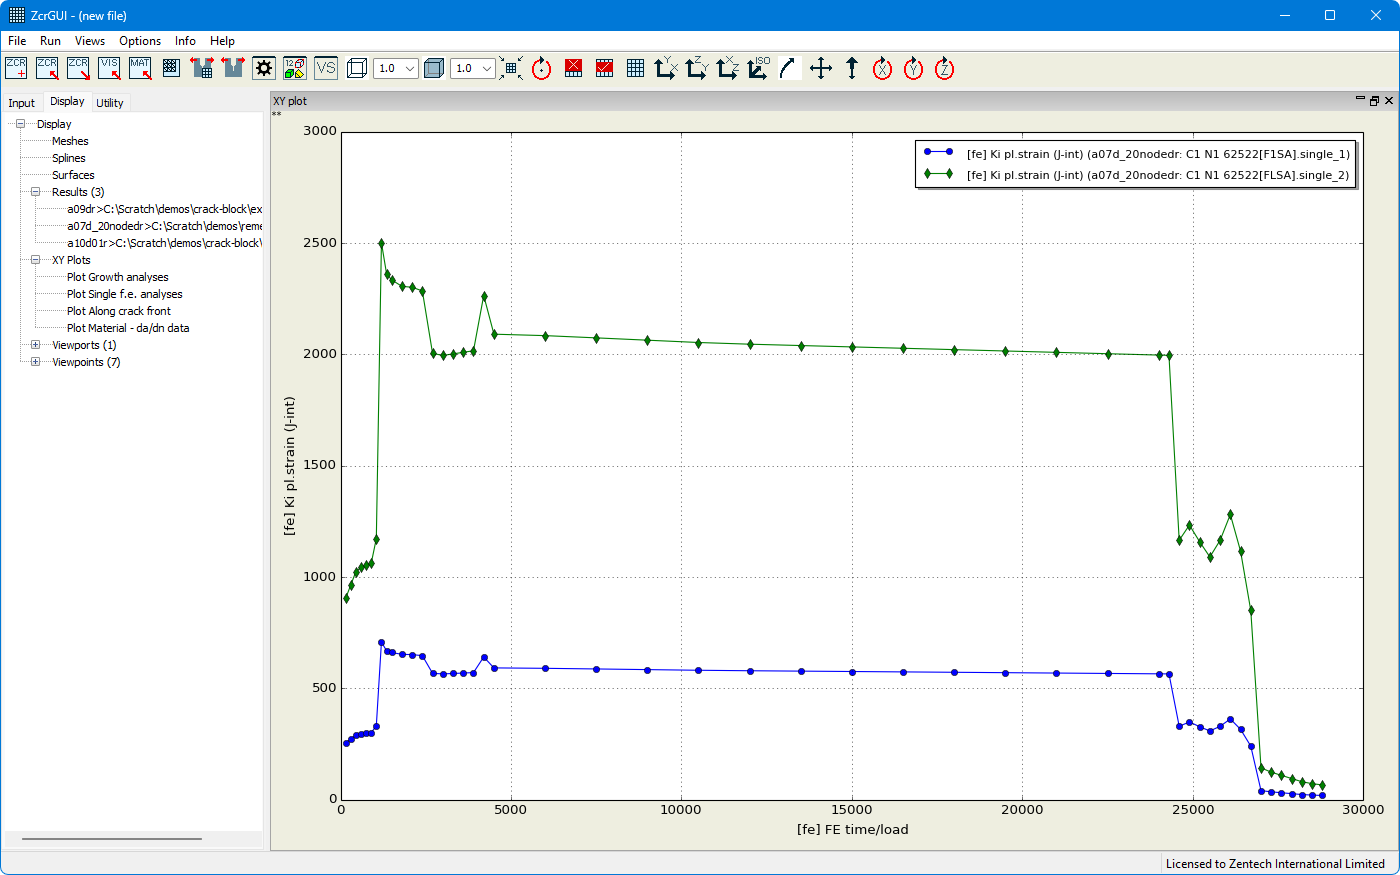
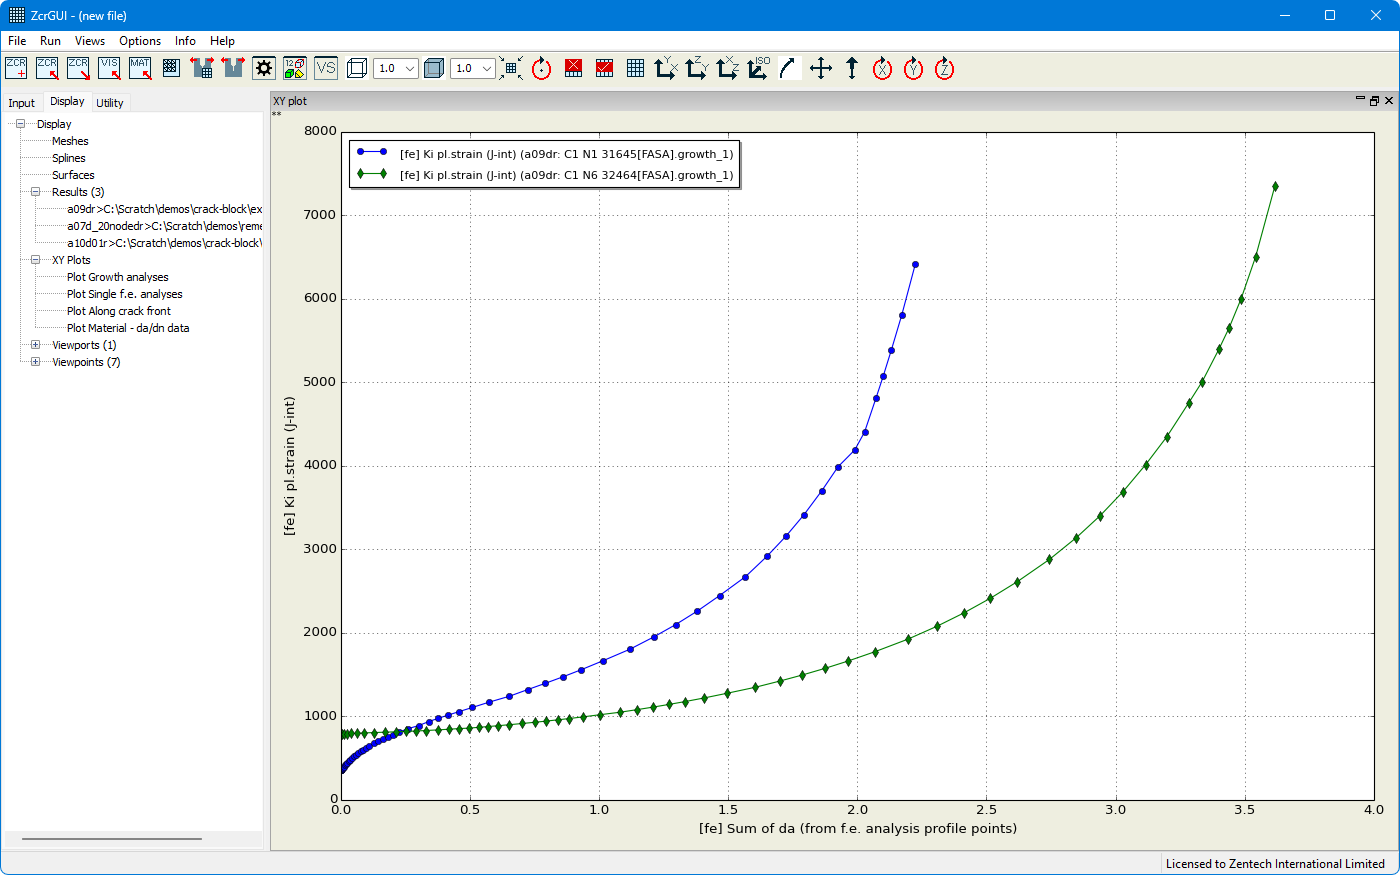
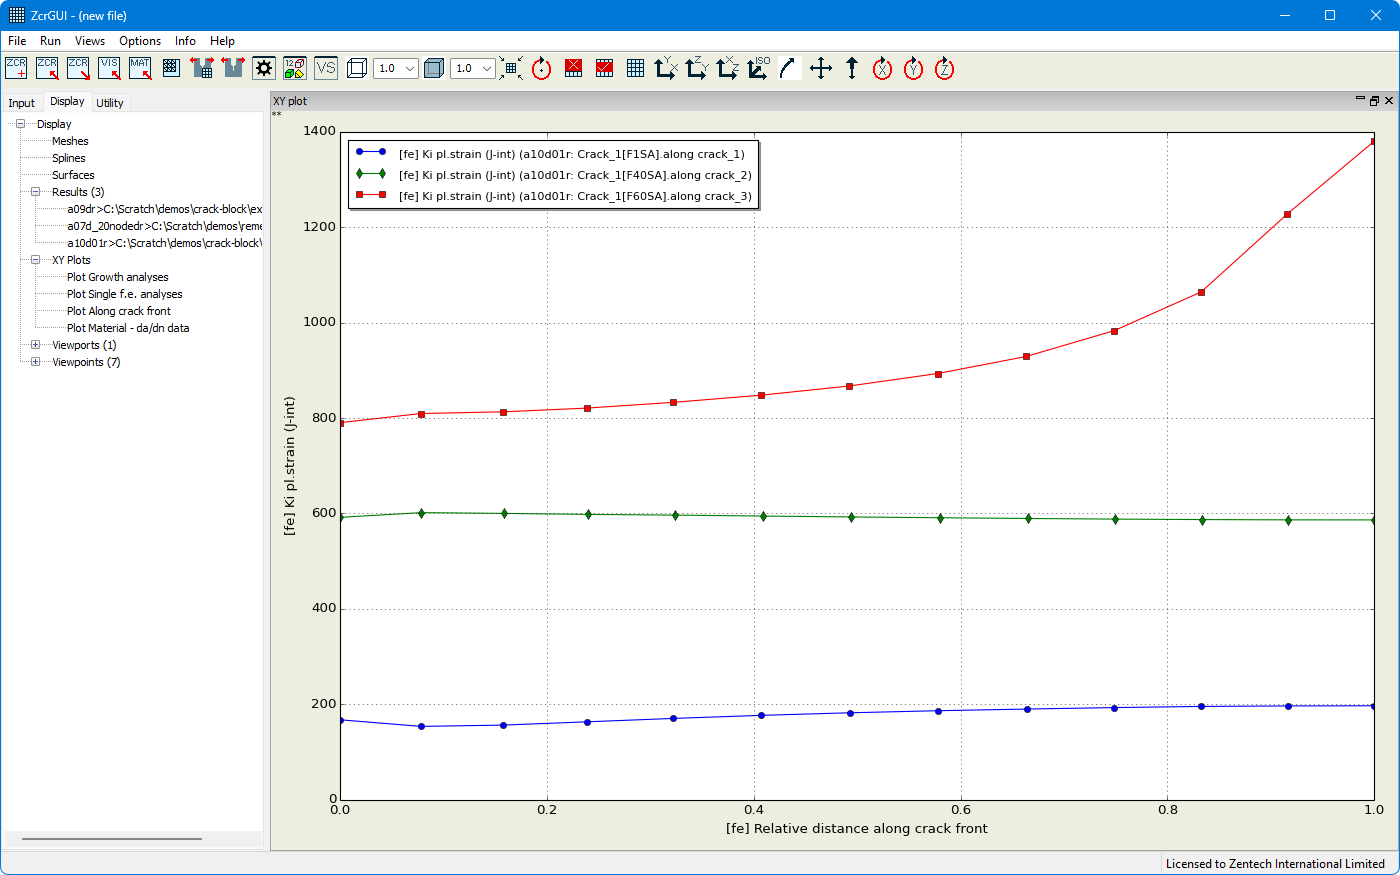
- XY plots for corner node positions or parametric positions at any location along the crack front may be plotted. Key variables are available such as Ki, G, cycles, time, sum of da etc., as well as other data such as raw contour integral values. The plots may be for results through multiple increments of a single f.e. analysis, for results extracted through a crack growth prediction or data for all positions along a crack front.
- The XY plotting and profile plotting capabilities allow plotting of data from multiple Zencrack analyses in the same viewport to allow quick and easy comparison of several jobs.
- The cracked mesh input files can be saved during a crack growth analysis and later imported to the GUI using the "Meshes" branch in the Display tab tree.
- A calculated crack profile during a growth analysis can be extracted to a spline for display in the "Spline" branch in the Display tab tree. Any spline data can be created in this branch and, if required, transferred back into a Zencrack input file.
Zencrack
Zencrack GUI
More in this category